All right, let's be honest.
You know your business needs "marketing metrics" - whatever the hell that actually means.
Everyone's telling you that you need to track impressions, engagement rates, CPCs, CTRs, and a million other acronyms that sound important but nothing makes sense to you.
Where the hell do you even start?
No time to read but prefer a video then, watch the Youtube video below.
Here's the thing: most Australian businesses in the $1-3M range are drowning in marketing data that doesn't mean a bloody thing for their bottom line. After working with dozens of businesses just like yours across Melbourne and Sydney, I've found that only five metrics actually matter when it comes to driving real growth.
Forget the fancy dashboards and AI-powered analytics platforms that cost more than they're worth. These five straightforward measures will give you 90% of the insight with 10% of the complexity. Let's dive in, mate.
Why Most Marketing Metrics Are Useless for Your Business
Before we get to the good stuff, let's talk about why most metrics fail businesses in the $1-3M range:
- They're too complex to implement consistently - You don't have a dedicated analytics team
- They require technical expertise you don't have - And shouldn't need to hire for
- They don't connect directly to revenue - Likes and shares don't pay the bills
- They create the illusion of marketing success without business results - "Great engagement" doesn't mean great sales
The fastest-growing companies in your segment don't waste time on vanity metrics. They focus relentlessly on these five numbers:
1. Cost Per Lead (CPL)
What it is: How much you're paying to get someone interested in your business.
The formula: Number of leads divided by the cost to generate them.
Let's use a real example. Say you get 100 calls or form submissions per month, and you're spending $3,000 on Google Ads plus agency fees. Your cost per lead is $30 (that's $3,000 ÷ 100).
This number is crucial because it immediately tells you if your marketing is financially viable. If you're selling a product for $20, but spending $30 to acquire each potential customer, you've got a bloody problem before you even factor in your actual product costs.
What to aim for in Australia:
- Service businesses: $50-200 per qualified lead
- Product businesses: $20-75 per qualified lead (Depends on the cost obviously)
- High-value B2B: Up to $500 per qualified lead (if your average deal size justifies it)
The businesses seeing the best results track this weekly by marketing channels (Google, Facebook, LinkedIn, etc.) and simply move budget from high-cost to low-cost channels each month.
Real-world example: A Melbourne financial services firm we worked with discovered they were paying $320 per lead from LinkedIn ads but only $140 per lead from Google Search. By shifting 60% of their LinkedIn budget to Google, they maintained the same lead volume but saved over $4,300 per month.
Quick implementation tip: Create a dead simple spreadsheet with:
- Marketing channel (Google, Facebook, organic, etc.)
- Monthly spend
- Number of leads generated
- Cost per lead (spend ÷ leads)
Calculate your CPL for each channel, and you'll immediately see which activities deserve more of your budget.
2. Lead-to-Sale Conversion Rate
What it is: Out of everyone who contacts your business, how many actually become paying customers?
The formula: Number of sales divided by number of leads.
For example, if you get 100 calls per month and convert 10 of these to actual sales, your lead-to-sale conversion rate is 10%.
But is that good or rubbish? It depends on your industry. You can use ChatGPT to find typical rates for your specific business type - just ask.
What's the average lead-to-sale conversion rate for [your industry] in Australia? Dig up latest metrics
The businesses growing fastest in this revenue range know this number by heart and review it monthly. Rather than complex CRM setups, they use simple spreadsheet tracking with these typical targets:
- B2B services: 10-20% conversion
- B2C products: 2-5% conversion
- SaaS businesses: 7-15% conversion
- Retail businesses: 3-8% conversion
Here's the key insight: if your conversion rate is significantly lower than industry standards, you don't have a marketing problem - you have a sales problem. Either your value proposition isn't connecting with leads, your price point is off, or your sales process needs work.
Real-world example: A Sydney-based SaaS company we consulted with increased their conversion rate from 8% to 12% by simply changing their demo process to include a pre-qualification questionnaire. This delivered a $350K annual revenue increase without spending an extra dollar on marketing.
The businesses that outperform their competition improve this metric by just 2-3% rather than doubling their marketing budget. It's about quality, not just quantity.
Implementation tip: Track every lead in a simple spreadsheet with:
- Lead source
- Date received
- Follow-up actions
- Final outcome (converted or lost)
- Reason won/lost (if known)
This basic tracking will reveal patterns that sophisticated CRMs often obscure.
3. Average Sale Value
What it is: How much each customer spends with you.
The formula: Revenue divided by number of sales.
Let's say you did $10,000 in sales from 100 orders. Your average sale value is $100 per order.
This straightforward number is overlooked by most businesses your size, yet directly impacts profitability. The businesses growing fastest in your segment actively work to increase this through:
- Simple upsell offers (like extended warranties or premium service options)
- Packaging/bundling services (combining complementary products/services)
- Testing different price points (often finding they can charge more with minimal impact on conversion)
- Creating tiered offerings (basic, standard, premium)
For example, if you're in digital marketing like me, you might bundle search engine optimisation, Google Ads, and website optimisation. You discount each component slightly, but the total package value increases your average sale.
Real-world example: An e-commerce client selling fitness equipment added a simple "frequently bought together" section at checkout, suggesting appropriate accessories for each main product. Their average sale value increased from $120 to $155 within 30 days - a 29% improvement without any additional marketing costs.
The businesses seeing sustainable growth track this monthly and celebrate small wins – I've seen 15-25% increases in average sale value deliver more profit than any marketing campaign.
Implementation tip: Calculate this by dividing your total revenue by the number of sales. Then brainstorm three ways you could increase this number by 10% in the next quarter.
4. Customer Source Tracking
What it is: Understanding where your actual paying customers are coming from.
Forget complex attribution models. The best-performing businesses at your scale don't use complicated attribution software – they simply ask new customers "How did you hear about us?" and keep a basic tally.
For e-commerce businesses, Google Analytics can provide this data automatically. Here's an example from one of my clients:
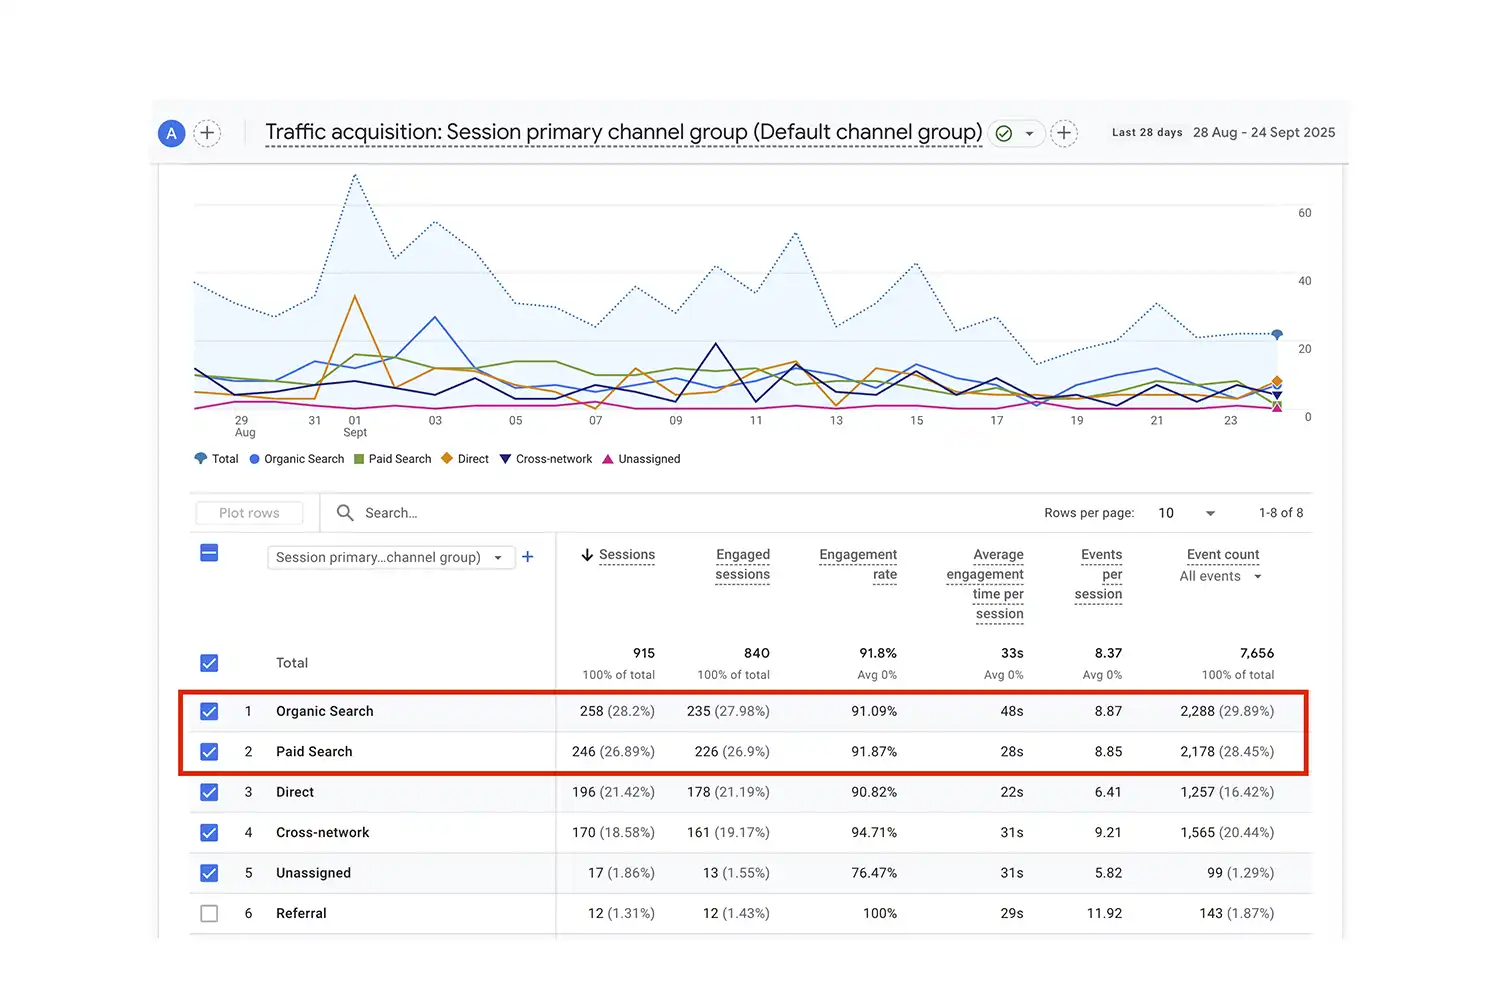
When looking at their traffic acquisition report, I could see about half their visitors were finding them through organic search (because we were doing SEO) and half through paid ads. But more importantly, I could see which channel was actually generating phone calls, map direction requests, and form submissions.
By tracking conversions by channel, we discovered that while paid ads brought in more total visitors, organic search visitors were twice as likely to become paying customers.
Why this matters: If you're not tracking where your customers come from, you're probably wasting money on channels that drive traffic but not sales.
Different approaches by business type:
- For service businesses: Train your team to ask every new customer, "How did you hear about us?" and track responses in a spreadsheet. Make this question mandatory in your intake process.
- For e-commerce: Set up basic Google Analytics conversion tracking and UTM parameters for your marketing campaigns.
- For B2B: Create a dropdown field in your CRM for "lead source" and ensure it's filled for every new opportunity.
Pro tip: Create a dropdown menu in your sales or onboarding forms with 5-7 marketing channels you use. This makes tracking consistent and gives you actionable data within weeks, not months.
5. Marketing ROI (Simple Version)
What it is: For every dollar you spend on marketing, how many are you getting back?
The formula: New revenue from new customers ÷ Marketing spend = Marketing ROI
The businesses seeing sustainable growth maintain a 3:1 ratio or better. That means for every $1 spent on marketing, they're generating at least $3 in new revenue.
Interpretation guide:
- Below 1:1 - You're losing money on marketing
- At 1:1 - You're breaking even, covering costs but not growing
- 2:1 to 3:1 - You're seeing healthy growth
- Above 5:1 - Your marketing is highly effective (or you're not investing enough)
If you're just starting out, don't panic if this number is low or even negative. Marketing takes time to generate results. But if you've been at it for 12+ months and your ratio is still below 1:1, your marketing strategy needs a serious rethink.
Real-world example: A Melbourne-based trade business was spending $8,000 per month across various marketing channels, generating about $20,000 in new business - a 2.5:1 ROI. By cutting the lowest-performing channel and reallocating that budget, they improved to a 3.8:1 ROI within 60 days, adding an extra $10,400 in monthly revenue without increasing their marketing budget.
The businesses that outperform their competition calculate this quarterly – not relying on agencies to provide this number. They own their marketing data and make decisions based on it.
Calculation tip: For more accurate calculations:
- Only count revenue from new customers (not repeat business)
- Include all marketing costs (agency fees, ad spend, software)
- Use a rolling 3-month average to smooth out fluctuations
Common Mistakes When Tracking These Metrics
Even with these simplified metrics, there are pitfalls to avoid:
- Measuring too frequently: Daily fluctuations can lead to panic decisions. Stick to weekly, monthly, or quarterly reviews depending on the metric.
- Not segmenting by channel: Different marketing channels should have different expectations. Your Google Ads CPL will likely be different from your Facebook CPL.
- Focusing on improvement without context: A 20% improvement sounds great, but if you're still well below industry benchmarks, more work is needed.
- Ignoring seasonality: Most Australian businesses see significant seasonal fluctuations. Compare year-over-year performance for more accurate insights.
- Letting agencies control your data: Always maintain direct access to your marketing data. Too many agencies obscure poor performance behind complex reports.
Why These Five Metrics Work for Australian Businesses Your Size
Most businesses in the $1-3M range waste money on complicated tracking setups they never fully implement. The companies growing fastest use the simple metrics above, calculated consistently, to make clear decisions about where to invest their limited marketing dollars.
These five metrics fit on a single sheet of paper, can be tracked in Excel, and give you the insights you need without requiring a dedicated analytics team or a marketing degree.
Don't get distracted by the latest marketing trends or fancy dashboards. Focus on these five numbers, and you'll have a clearer picture of your marketing effectiveness than 90% of your competitors.
Next Steps: Implementation
Ready to focus on metrics that actually drive growth? Here's your three-step plan:
- Create a simple tracking spreadsheet with these five metrics
- Set a calendar reminder to update and review it monthly
- Make one marketing decision based on the data each month
That's it. No fancy tech stack required.
References:
Below are the sources used to verify the data and benchmarks in this article
Cost Per Lead (CPL)
- WebApex Australia (2025). "Average Cost Per Lead by Industry & Price Calculator." Indicates CPL ranges from $20 to over $500 depending on industry, with service businesses typically at the higher end.
https://www.webapex.com.au/lead-cost
- First Page Sage (2025). "Average Cost Per Lead by Industry." Reveals industry-specific ranges, showing technology at $55 while education is around $8.
https://firstpagesage.com/reports/average-cost-per-lead-by-industry/
- Silver Mouse (2025). "What is the average cost per lead for B2B industries?" Confirms higher CPLs in markets like Australia compared to emerging markets.
https://www.silvermouse.com.my/blog/average-cost-per-lead-for-b2b-industries/
- ETRAFFIC Agency (2022). "Reduce Cost Per Lead." Notes that the average cost per lead in non-profits is $31, while in the technology industry it's $208.
https://www.etraffic.com.au/outcomes/decrease-cost-per-lead/
Lead-to-Sale Conversion Rate
- Ruler Analytics (2025). "Average Conversion Rate by Industry and Marketing Source." States the average conversion rate across industries is 2.6%, with B2B conversion rates typically ranging from 1.9% to 7%.
https://www.ruleranalytics.com/blog/insight/conversion-rate-by-industry/
- First Page Sage (2025). "Lead-to-MQL Conversion Rate Benchmarks." Shows the average lead-to-MQL conversion rate across all industries is 31%.
https://firstpagesage.com/reports/lead-to-mql-conversion-rate-benchmarks-by-industry-channel-fc/
- RedPandas Digital (2024). "Average Lead Close Rate for B2C & B2B Per Industry in Australia." Provides industry-specific ranges for lead conversion rates in the Australian market.
https://www.redpandas.com.au/blog/what-is-the-average-lead-close-rate-for-b2c-b2b-per-industry-in-australia/
- Unbiased (2024). "B2B conversion rates: benchmarks, strategies, & industry insights." Confirms the average B2B sales conversion rate at 1.9%, with professional services as high as 12.3%.
https://www.unbiased.co.uk/pro/discover/business-growth/b2b-conversion-rates-benchmarks-strategies-and-industry-insights
- First Page Sage (2025). "B2B Conversion Rates By Industry." Provides conversion rate data for 25 B2B industries and strategies to improve conversion rates.
https://firstpagesage.com/reports/b2b-conversion-rates-by-industry-fc
- Invesp (2024). "The Average Website Conversion Rate by Industry." Reports that the average conversion rate across all fourteen industries is 3.3%.
https://www.invespcro.com/cro/conversion-rate-by-industry/
- Salesforce ANZ (2025). "Conversion Rate and How to Calculate and Improve it." Indicates the average conversion rate for all industries is around 2-3%, with e-commerce websites averaging around 4%.
https://www.salesforce.com/au/blog/conversion-rates/
Average Sale Value
- Gorilla360 (2024). "Ecommerce Benchmarks and Metrics in Australia." Notes that the Average Order Value (AOV) across the APAC region is around $106, while emphasizing that this varies significantly by industry.
https://gorilla360.com.au/blog/ecommerce-benchmarks-and-metrics-in-australia/
- Adobe Business (2025). "ROI in digital marketing." Explains how average sale value affects predicted marketing returns.
https://business.adobe.com/blog/basics/understanding-roi-in-digital-marketing
- Smart Insights (2025). "E-commerce conversion rate benchmarks." Provides benchmarks for e-commerce conversion rates and average order values across different industries.
https://www.smartinsights.com/ecommerce/ecommerce-analytics/ecommerce-conversion-rates/
Marketing ROI
- Marketing Evolution (2025). "Marketing ROI: Definition and How to Measure It." States that the rule of thumb for marketing ROI is typically a 5:1 ratio, with exceptional ROI being considered at around 10:1.
https://www.marketingevolution.com/marketing-essentials/marketing-roi
- Oracle Australia (2025). "What is Marketing ROI?" States that an efficient marketing campaign typically sees a 5:1 ratio (400% ROI), while excellent campaigns reach 10:1 (900% ROI).
https://www.oracle.com/au/cx/marketing/marketing-roi/
- Hot Dog Marketing (2025). "What's a 'Good' ROI in Marketing?" Provides industry-specific benchmarks, with professional services targeting 3:1 to 5:1 ROI.
https://hotdogmarketing.com/whats-a-good-roi-in-marketing/
- First Page Sage (2025). "ROAS Statistics." Distinguishes between ROAS and ROI, showing how the same campaign can have a 2.13:1 ROAS but only 0.07:1 ROI when all costs are factored in.
https://firstpagesage.com/reports/roas-statistics/
- Salesforce ANZ (2025). "Marketing ROI (Return on Investment) Defined." Provides the formula for calculating marketing ROI and insights on different ways to measure marketing impact.
https://www.salesforce.com/au/marketing/analytics/roi-guide/
- FullFunnel (2025). "Sales & Marketing ROI: Benchmarks and Measuring Success." States that a common benchmark for high-growth companies is a 3:1 ratio of Lifetime Value (LTV) to Customer Acquisition Cost (CAC).
https://www.fullfunnel.co/blog/sales-and-marketing-roi-benchmarks-and-measuring-success